Summary
- Build your Financial Fortress with Dividends.
- Income Return is measurable and predictable.
- Total Return is a bimodal distribution with income and price components, confusing business outcomes and market outcomes along with different means and variations, which should not be combined for goal setting.
Intro to Robust Metrics
A robust metric detects what it wants to detect, and does not detect what it does not want to detect. While the virtues of setting goals and success metrics are self evident, the application of these virtues can span well outside products and operations. Practically, robust metrics exist to bring harmony to our lives, both personal and professional.
During the interview process, onboarding, and execution of a Data Scientist at Meta, the concept of a robust metric was ingrained into the decision making process. Natural curiosity eventually lead me to ask how financial planning goal setting based on net worth and market returns was robust.
A robust metric needs to work under all conditions, even the worst case. Robust metrics should avoid or attempt to control for the following:
- Outliers
- Long Tails
- Small Sample Sizes
- High variations
- Provide controllable inputs
Dividends and Price
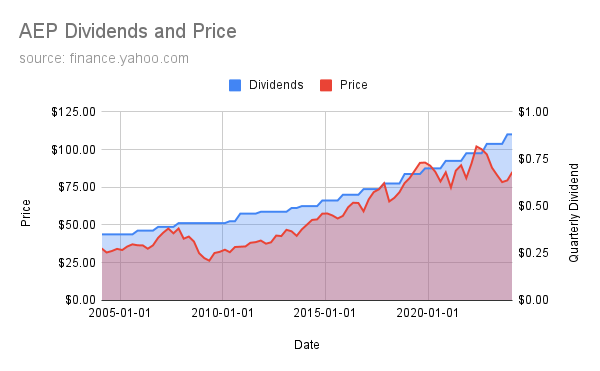
Let us review two lines for AEP, an electric utility, over the last 20 years with one showing price and one showing dividends.

There is a difference between market returns and business outcomes. A market return is composed of the starting and ending price and the dividends paid, also known as a Total Return. The distributions of variance in the price component (above) and of the dividends paid (above) are significantly different. Best not to have a metric that is composed of bimodal inputs and variances. One might want to split these out to find which input is robust and best suited for the use case.
A good dividend growth stock has positive dividends, paid quarterly, and typically raises the dividends each year. Four positive data points a year, increasing, in a straight line. An essentially straight line has low variance and high predictability. Better, this is a Business Outcome we can control by selecting good businesses.
While the ending point after 20 years between price and dividends might appear to be the same outcome, the journey matters. Humans need to know they are on the path to success or they might jump off it. When the red line dips, how is one to know, if this red line is the north star, that they are on the path to success? Hope that the price will go back. While statistically true generally, the practical link to fundaments, i.e. controllable inputs, might be a jump, especially if the stock does not have excellent business fundamentals. Why not focus on the fundamentals?
Metrics serve Goals
How can I know if I am on track to achieve my goals, i.e. pay my bills, each quarter?
Price return is not a robust metric. Setting a net worth goal and tracking with market returns is not robust. It is hope and not a plan to assume that over the long run the average return will be positive and the variance will eventually be less than the return. It is hope because it cannot be tracked incrementally with certainty even in the worst of times. That is when metrics REALLY matter. One knows a product and operation is BUILT LIKE A FORTRESS, when plans, operations, and metrics work in synergy to provide controllability and predictability.
- Price return (Total Return = Index Return) has variances higher than they return. In any given quarter the price could be +/- 10%. Further, price return is a market outcome and not a business outcome. Further, there really is only one data point that matters, when one sells. These data points are fiction for the holding until the holder switches from long term investor to seller. Best to have a robust metric that has real data points to measure that are impactful to the user. Data points on paper are just not real. Cash is real. Cash in the bank can be used to compound.
Robust Metrics mean Practical Metrics
- A robust metric needs to detect the status of success at all times, particularly in the worst of times.
- Measure real things.
- Provide the ability to plan, ex. predict over the short term and long term.
- Work with operations to provide controllable inputs.
- Metrics provides ample opportunity for integrating data and action that leads to impactful business outcomes.
- All while meeting the fundamentals like avoiding tails, outliers, which because it meets these fundamental statistical qualifications enables the metric to be practical, used in a variety of ways to achieve superior outcomes.
Perhaps, there is a Simpson’s paradox in financial planning that Modern Portfolio Theory is currently out of touch until the next crisis hits. A Simpson’s paradox that the trend in dividends drives the majority of returns through dividends, dividends reinvested, and dividend growth. When combined with total return, the price return makes this trend disappear.
